
Most marketing teams can tell you who owns the landing page. Few can tell you who will miss the deadline for it.
That gap defines the problem. Traditional marketing tools track project execution: tasks, owners, due dates, status. They answer “who is doing what.” They do not answer the question that decides whether a launch ships on time: does this team have the capacity to do it?
Resource optimization is a different discipline. It asks whether your senior designer is booked at 140% next Tuesday while two copywriters sit at 55%. It asks whether a product launch, a webinar series, and a rebrand can all land in the same quarter without wrecking the people building them.
When nobody asks, the damage is predictable. A writer quietly absorbs overflow. Revisions stack up. Creative quality drops. The best performer updates their résumé. The campaign stalls in the final week, and the post-mortem blames “communication.”
A new class of AI capacity planning software for marketing targets this failure directly. These platforms read live work, measure real load, and flag overload before it becomes a missed date. This guide breaks down the metrics, explains why legacy tools fall short, compares the leading platforms for 2026, and gives you a deployment blueprint.
Understanding the Metrics: Workload Visibility vs. Capacity Utilization
Teams use these terms interchangeably. They are not the same thing.
Workload Visibility
Workload visibility is the transparent, shared view of task volume across people, teams, and campaigns. It answers: how much work exists, where does it sit, and who is carrying it?
Good visibility is cross-functional. A content lead should see not only their writers’ queues but the design requests, legal reviews, and web production tickets that feed the same launch. Without that, every team optimizes locally and the campaign suffers globally.
Capacity Utilization
Capacity utilization measures the share of a person’s actual available time spent on productive, planned deliverables, as opposed to empty administrative load such as status meetings, re-briefing, approval chasing, and rework.
The formula is simple:
Utilization % = Productive deliverable hours ÷ Available hours
The key word is available. A 40-hour week is not 40 available hours. Subtract PTO, standing meetings, training, and the unavoidable overhead of coordination. Teams that skip this step overstate capacity by 20% to 30% and then wonder why every sprint slips.
The 75-80% Rule
The working benchmark for creative and marketing teams is a 75% to 80% utilization threshold. Treat it as a planning target, not a law of physics.
Why not 100%? Because creative work is variable. Briefs change. Executives reroute priorities. A hero asset needs three extra rounds. A team planned to 100% has no shock absorber, so every surprise becomes a missed deadline or unpaid overtime.
The operating bands look like this:
- Below 65%: Underused capacity. Budget is leaking, or work is hidden from the system.
- 75-80%: The target zone. Quality holds, rework stays low, and the team can absorb urgent requests.
- 85-90%: Warning zone. Output looks strong for a few weeks, then error rates and attrition risk climb.
- Above 95%: Burnout territory. Creative friction, sloppy handoffs, and resignations follow.
Visibility shows you the work. Utilization tells you whether the work fits the people. You need both, and you need them live.
Why Traditional Project Management Software Fails
Spreadsheets and basic Kanban boards were built to record work. They were never built to model capacity. Four structural failures explain the gap.
1. They depend on manual input. A spreadsheet is accurate for exactly as long as someone updates it. Kanban cards move only when a human drags them. In a busy week, the update is the first task to die. The data decays, and leaders end up planning from fiction.
2. They show status, not load. A board with 40 cards in “In Progress” tells you nothing about hours, skill requirements, or who is overbooked. Ten cards for one person and ten cards for ten people look identical.
3. They are blind to estimation error. Static tools take the estimate you typed at kickoff and treat it as truth. They never learn that your video team routinely runs 30% over on motion graphics.
4. They are reactive. By the time a card turns red, the delay already exists. Static tools report problems. They do not predict them.
AI-driven resource tools work differently. They read dynamic digital pipelines instead of waiting for manual updates. They ingest real-time time-logs, task movement, and calendar signals. They compare plans against historical delivery patterns and automatically forecast resource gaps weeks before delivery blocks occur.
That shift, from recording to predicting, is the core value. A good set of real-time workload management tools does not wait for a stressed manager to raise a hand. It raises the flag first.
The practical output is a set of team capacity visibility dashboards that update continuously and show load by person, skill, team, and campaign. Leaders stop debating whose spreadsheet is correct and start deciding what to move.
Top AI Marketing Workload Visibility and Capacity Utilization Tools in 2026
The market spans work management suites, outcome-focused platforms, and forecasting specialists. Each below is assessed on how it handles load visibility, predictive capability, and fit. Feature sets change quickly, so confirm current packaging and availability with each vendor before purchase.
monday.com (AI Workspace)
monday.com is the strongest all-rounder for teams that want resource management inside a familiar work operating system.
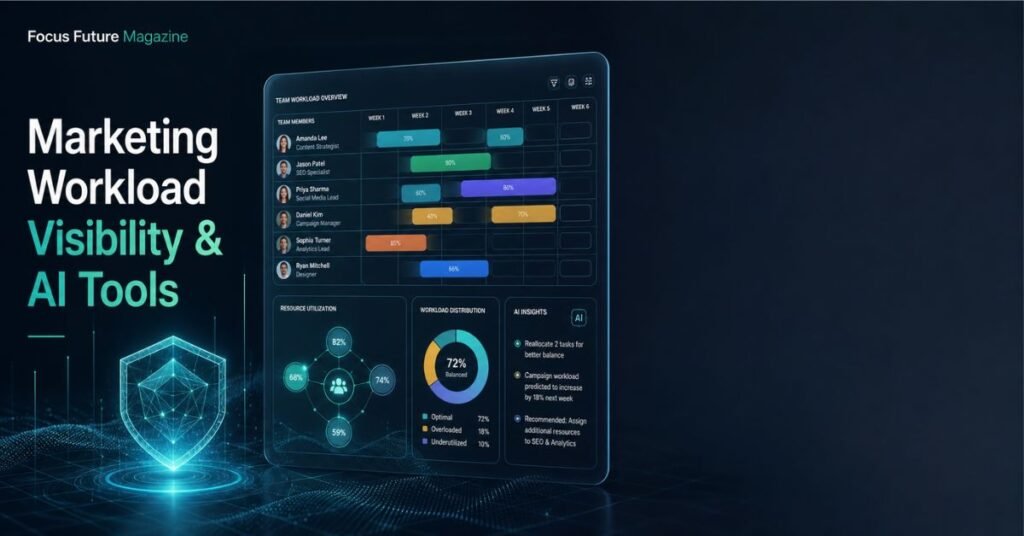
Its anchor feature is the Workload View, a color-coded allocation dashboard. Each person appears as a row, each week as a column, and colors flag under-allocation, healthy load, and overload. A marketing ops lead can scan a quarter in seconds and spot the person at 120% before the sprint starts.
The more interesting layer is its Workload Balancer AI agent. When an editor or writer triggers an overload alert, the agent works to redistribute assignments natively, weighing who has room instead of waiting for a manager to hand-edit the board. That turns a flag into an action.
What to scrutinize:
- Strength: Fast adoption, flexible boards, and strong automation recipes that make real-time workload management tools accessible to non-technical teams.
- Watch-out: Quality of automated redistribution depends on clean skill tagging and accurate effort estimates. Garbage in, balanced garbage out.
- Best fit: Mid-market and enterprise marketing teams that want visibility and automation in one workspace.
Abloomify
Abloomify takes a different angle: outcome-connected tracking. Most tools ask how busy people are. Abloomify asks whether the busyness is producing results.
Its conversational AI, Bloomy, maps live team workflows to active marketing channels and campaign ROI signals. A leader can ask in plain language where effort is going and what it is returning, then use the answer to guide reallocation. If a team is spending 35% of its hours on a channel that produces a small share of pipeline, the system surfaces the mismatch.
This matters because pure utilization can mislead. A team can sit at a perfect 78% and still be pointed at the wrong work. Linking load to outcome closes that loop.
What to scrutinize:
- Strength: Connects capacity to performance, which is the conversation executives actually want to have.
- Watch-out: Outcome mapping is only as good as your attribution data. If channel reporting is messy, fix that first.
- Best fit: Performance-driven teams that need to defend headcount and justify reallocation with revenue signals.
Forecast.app
Forecast.app is the most explicitly predictive of the group. It applies machine learning to historical campaign metadata to improve task estimation and to auto-schedule timelines based on historical skill availability.
The logic is sound. Your own past is the best predictor of your future. If similar email campaigns took a senior designer 11 hours, not the 6 someone guessed, the model learns that and adjusts. Over time, estimates converge on reality and schedules stop lying.
For agencies and in-house studios that sell or budget time, this is the heart of AI capacity planning software for marketing: better estimates, earlier warnings, fewer surprises.
What to scrutinize:
- Strength: Strong forecasting and scheduling logic, with a financial lens useful to agencies.
- Watch-out: It needs historical data to learn. Teams with thin or inconsistent records will see weaker predictions early on.
- Best fit: Agencies and project-based creative teams with repeatable work types and billable time.
Wrike and Asana (AI Features)
The two incumbents deserve attention because many enterprises already own one.
Wrike is strongest at the front door. Its dynamic request intake forms capture structured demand from across the business, and its smart prioritization rules help rank incoming work against capacity and business rules. For centralized marketing services teams drowning in ad hoc asks, controlling intake is often the highest-leverage fix.
Asana approaches the problem through automated workload portfolios built for creative agencies and in-house studios. Portfolios roll up project status and team load, so leaders see how competing initiatives pull on the same people. Asana’s AI features add summarization, status updates, and smart assistance on top of that structure.
Both are credible choices. Both are strongest when you want AI layered onto an existing system of record instead of replacing it.
What to scrutinize:
- Wrike strength: Governance, intake control, and enterprise-grade workflow rules.
- Asana strength: Clean portfolio-level view and wide team adoption.
- Watch-out for both: Depth of capacity modeling and forecasting varies by plan tier. Verify what is included before assuming parity with specialist tools.
Head-to-Head Comparison Table
| Tool Name | Core AI Capability | Best For | Key System Integration |
|---|---|---|---|
| monday.com | Workload Balancer AI agent with color-coded Workload View; auto-redistributes tasks on overload alerts | Mid-market and enterprise marketing teams wanting visibility plus automation | Native automations; common connections to CRM, Slack, and calendar tools |
| Abloomify | Bloomy conversational AI linking team workflows to marketing channels and campaign ROI signals | Performance-driven teams justifying reallocation with outcome data | Marketing channel, analytics, and work-tracking data sources |
| Forecast.app | Machine learning on historical campaign metadata for estimation and auto-scheduling by skill availability | Agencies and project-based creative studios with billable work | Time tracking, project, and finance data connections |
| Wrike | Dynamic request intake and smart prioritization rules | Centralized marketing services teams managing high request volume | Broad enterprise integration library, including CRM and creative tools |
| Asana | Automated workload portfolios and AI-assisted status and summaries | Creative agencies and in-house studios needing portfolio-level load views | Wide app ecosystem, including design, Slack, and CRM connections |
Integration lists are directional. Confirm current connectors and plan limits in each vendor’s documentation before committing.
Implementation Blueprint: How to Deploy an AI Resource Tool
Buying the tool is the easy part. Operational discipline decides whether it works. Follow this sequence.
Step 1: Audit Your Real Workflows
Map how work actually enters, moves, and exits your team. Not the process on the slide. The real one.
- List every intake channel: email, chat, forms, hallway requests, executive asks.
- Identify shadow work: tasks that consume hours but never appear in any system.
- Separate productive deliverables from administrative load so you can measure true utilization.
- Document roles and skills. Your AI cannot balance load across skills you have not defined.
Expect ugly findings. Most audits reveal that 20% or more of team time goes to unlogged coordination.
Step 2: Baseline Your Historical Tracking Habits
AI forecasting needs history. Before you switch anything on, take stock of what data exists.
- Pull 6 to 12 months of project, task, and time records.
- Measure estimate accuracy: planned hours versus actual hours by work type.
- Calculate each team’s baseline capacity utilization against available, not nominal, hours.
- Flag gaps. If people never logged time, start a lightweight logging habit now. Even four weeks of consistent data improves early model quality.
Step 3: Connect Your API Data Sources
A resource tool starved of data is just another dashboard. Connect the systems that reflect real work.
- Work management: your existing project and task system.
- Calendars: to subtract meetings and PTO from true availability.
- Communication tools: to capture request flow and response lag.
- CRM and marketing automation: to tie load to campaign outcomes.
- Time tracking and finance: to reconcile hours with budget.
Use API and native integrations over manual imports. Automated feeds are what let team capacity visibility dashboards stay current without a human babysitter. Assign a named owner for data quality, and validate the first two weeks of feeds line by line.
Step 4: Establish Operational Guardrails
Automation without limits creates new problems. Set rules before the AI starts moving work.
- Utilization thresholds: Alert at 85% and escalate at 95%. Keep the 75-80% band as the planning target.
- Approval rules: Let AI propose reassignments, and require manager sign-off on changes to client-facing or high-visibility work, at least during the first quarter.
- Skill boundaries: Prevent automated moves that assign specialist work to unqualified people.
- Priority hierarchy: Define which campaigns win when capacity collides. The tool enforces your rules. It cannot invent them.
- Privacy and trust: Be transparent that the system measures workload, not individual surveillance. Teams that feel monitored will game the data.
Step 5: Pilot, Measure, Expand
Start with one team or one campaign cycle. Do not roll out company-wide on day one.
Track a short list of outcomes:
- On-time delivery rate
- Estimate accuracy (planned versus actual hours)
- Rework and revision cycles
- Overtime hours and burnout signals
- Voluntary attrition in the pilot group
Review weekly for the first month, then monthly. Tune thresholds, fix tagging errors, and retrain the team on logging habits. Expand only after the pilot proves it moves business throughput, not just dashboard activity.
The Bottom Line
Execution tools tell you what happened. AI capacity planning software for marketing tells you what is about to happen, while you can still change it.
Pick the platform that matches your actual problem. Choose monday.com for automated load balancing inside one workspace. Choose Abloomify to tie effort to outcomes. Choose Forecast.app for predictive scheduling and estimation. Choose Wrike or Asana when you want to extend an existing system of record.
Then do the unglamorous work: clean the data, set the guardrails, and hold the line near 75-80% utilization. The tool provides the signal. Your operating discipline decides whether anyone acts on it.